Net Promoter Score (NPS): The Ultimate Guide
- Ethan Parker
- 01 Feb, 2025

Struggling to understand how your customers really feel about your brand? Lacking any kind of measure, it feels like mere guessing to improve customer loyalty. That is where Net Promoter Score (NPS) enters: simple and powerful means for assessment of customer satisfaction and business growth prediction. By asking only one simple question, you can unleash the practical insight that will let you retain customers, improve experiences, and ultimately drive success. Are you ready to turn feedback into results? Let’s dive into everything you need to know about NPS.
1. What is Net Promoter Score?
The NPS is widely used to measure customer loyalty and satisfaction. By asking one simple question-that of how likely customers are to recommend a product or service-businesses can gather much insight into the general customer experience. The NPS is relatively easy to calculate and gives a good benchmark to compare customer sentiment over time.
1.1 History and Origin of NPS
NPS was introduced in 2003 by Fred Reichheld, Bain & Company, and Satmetrix as a simple but effective tool to measure customer loyalty. It came into being because of the felt need to have one metric that could clearly tie customer satisfaction with business growth. It has been so widely adopted today that it has become a cornerstone of customer experience programs across the world.
1.2. Why NPS Matters
NPS is not just a number; it’s a window into customer sentiment and a barometer of business health. It helps an organization understand the promoters, passives, and detractors in their midst and gives actionable insights to retain more customers, foster loyalty, and ensure growth in the long run. Because it’s simple to implement and because one can see tangible results from it, it’s an invaluable tool across businesses.
2. How to Run Surveys and Collect NPS Data
Effective collection of NPS data begins with designing the right surveys and strategically distributing them. An NPS survey focuses on actionable customer feedback to understand satisfaction, determine areas of improvement, and create loyalty for businesses. Here is a breakdown of how one can create and structure an effective NPS survey.
2.1. How Do You Create an NPS Survey?
An NPS survey comprises the development of a concise and focused questionnaire. Keep the survey short to maximize completion rates and make it easy for respondents to provide their feedback. This includes the core NPS question supported by follow-on questions to gather deeper insights into the customer experience.
2.2. The Net Promoter Score Question
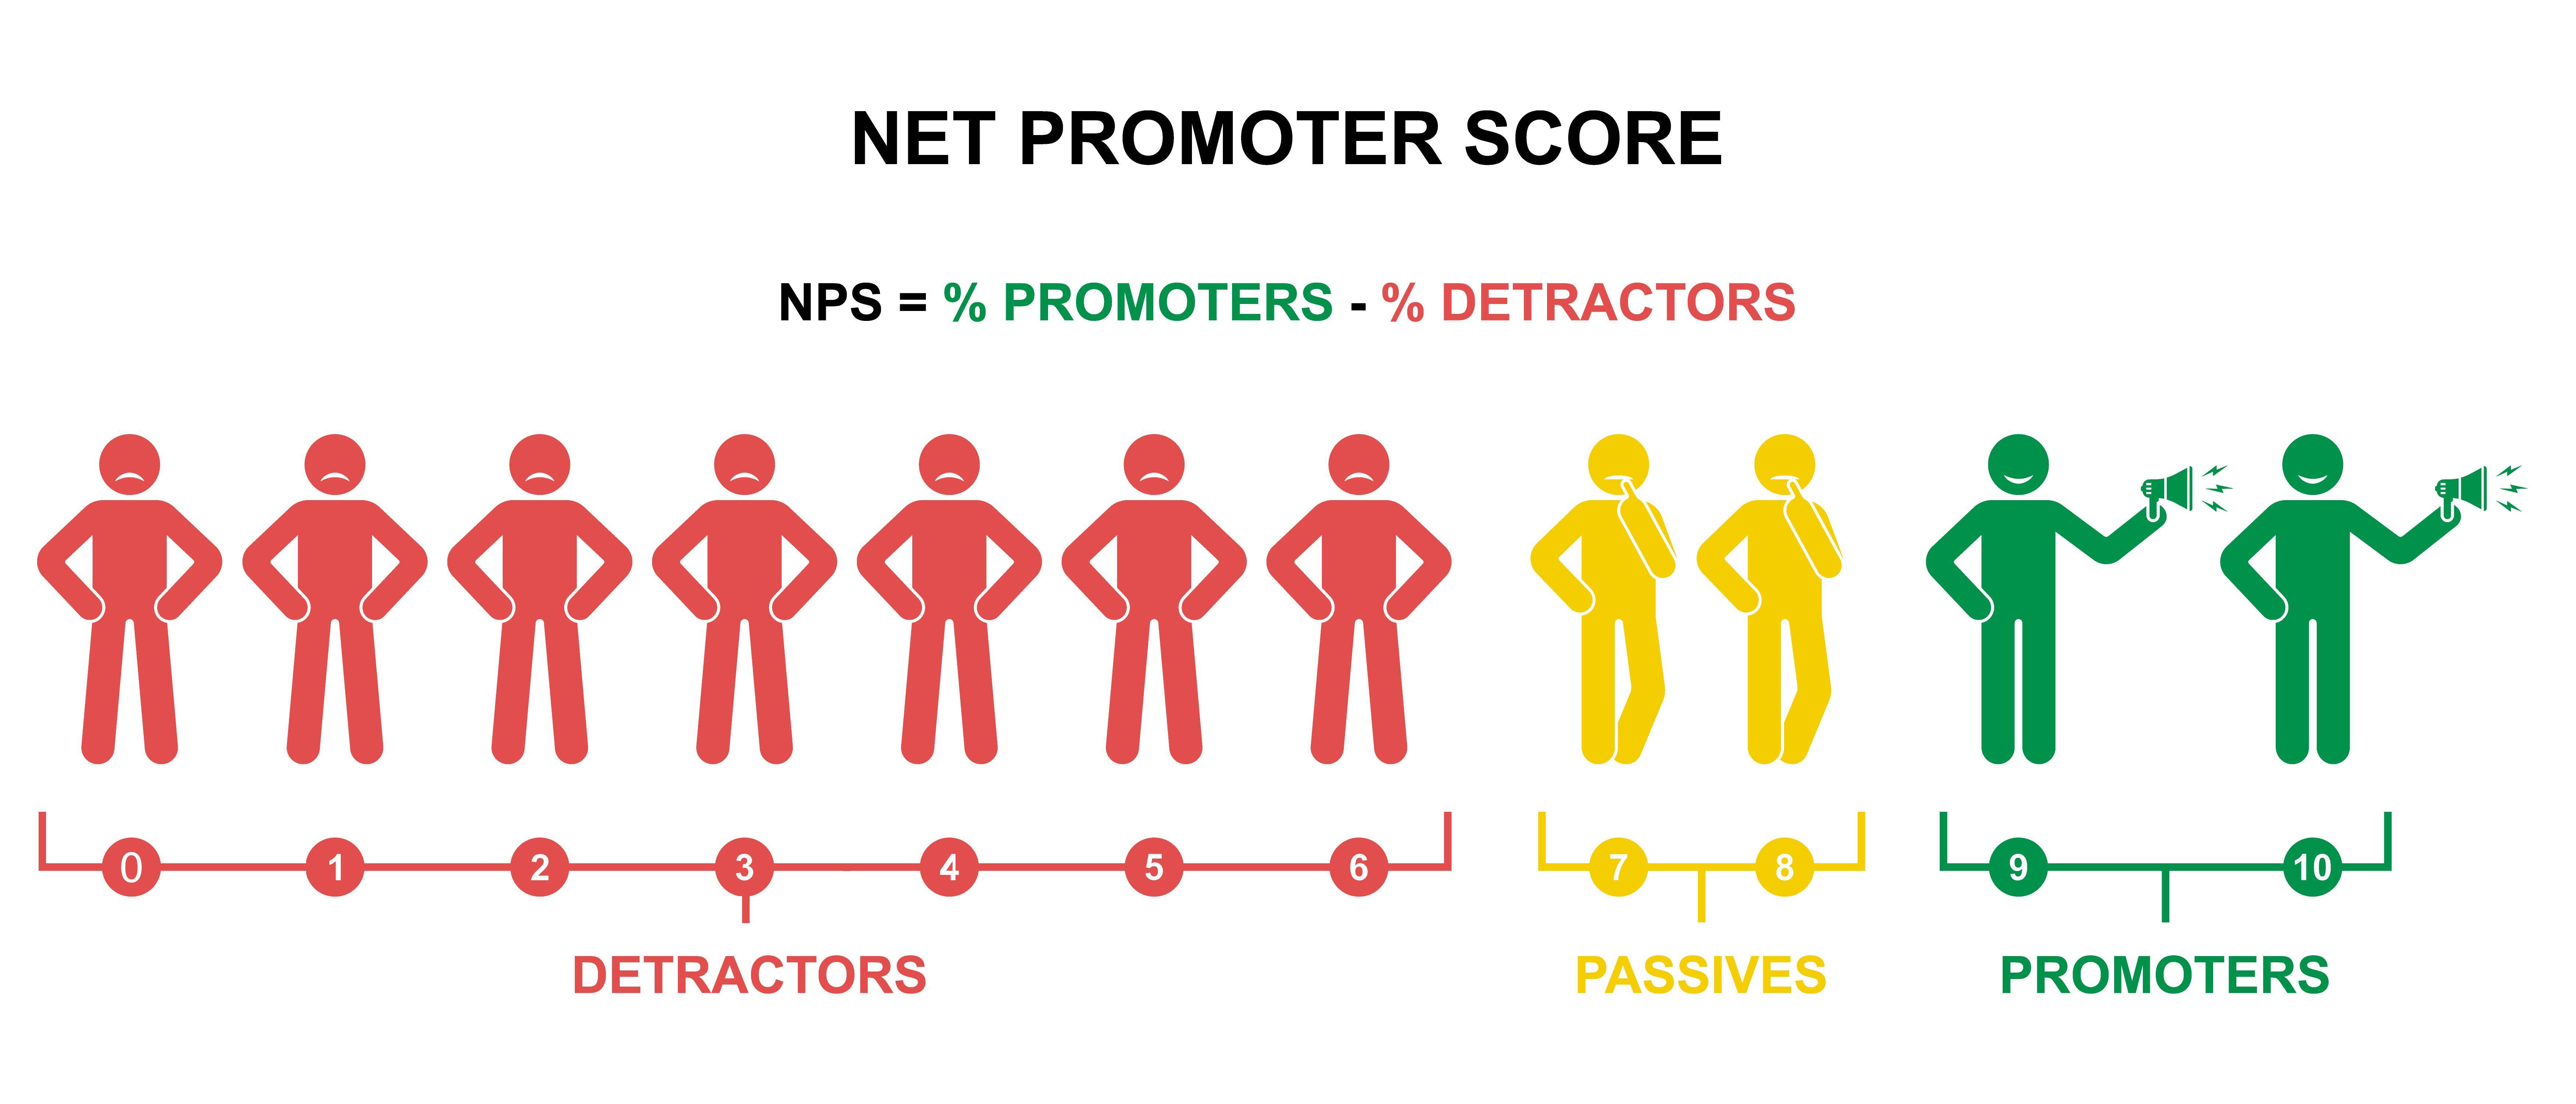
The root of any NPS survey is the essential question: “On a scale of 0 to 10, how likely are you to recommend our product/service to a friend or colleague?” Customers then answer on this scale, from 0 to 10, which later segments them as detractors (0-6), passives (7-8), and promoters (9-10). This very question provides data necessary for calculation in your NPS score.
2.3. What’s the Reason for Your Score?
This open-ended question invites the respondents to elaborate on the given score. Through their responses, they give you qualitative insights about what drives customers to be satisfied or unsatisfied. These insights help the business pinpoint strengths and where improvements are to be made.
2.4. How Can We Make Your Experience Better?
This follow-up question is regarding actionable feedback. Asking what can be done to improve customers’ experiences lets businesses know directly what to enhance about their products, services, or customer journey. That kind of attitude reflects that much effort has been taken to improve customer satisfaction and loyalty. With this, companies will have the ability to send efficient NPS surveys to their customers, which will provide them with quantitative and qualitative insights to drive effective improvements.
3. How to Interpret the NPS Scale
Understanding the NPS scale is important for actionable insights from customer feedback. The NPS categorizes respondents into three distinct groups: Detractors, Passives, and Promoters, based on their likelihood to recommend your product or service. Each group represents a unique aspect of customer sentiment, enabling businesses to target their efforts effectively.
3.1 Detractors (0–6)
Detractors: These are customers who have rated their likelihood to recommend between 0 and 6. They are unhappy or unimpressed with their experience and can even advocate negative word-of-mouth that hurts your brand. Know their pain points and ensure the resolution of issues to make the detractors your advocates. Their feedback has often pointed toward areas of improvement, and this feedback is a good resource to refine your offering.
3.2 Passives (7–8)
Passives are customers giving their likelihood of recommending a grade of 7 or 8. Basically, they are satisfied at a middle level only, where there is not even the enthusiasm to actively promote your brand. Furthermore, they easily tend to migrate to competitors. Interaction with them reveals what interferes with making them Promoters and gives opportunities for increasing the level of their loyalty.
3.3 Promoters (9–10)
Promoters: These are customers who gave a rating of 9 or 10 for their likelihood to recommend. They are very satisfied and loyal promoters who are very likely to refer your brand to others, helping in word-of-mouth marketing and growth. Promoters form the backbone in customer loyalty, and nurturing their relationship with rewards, recognition, or exceptional service ensures they remain strong supporters of your brand. By analyzing the distribution of Detractors, Passives, and Promoters, businesses will be able to understand customer sentiments better, recognize areas they need to work on, and devise targeted strategies toward loyalty and improvement.
4. How To Calculate Net Promoter Score?
Calculation of NPS is an absolute must when it comes to interpreting customer loyalty and satisfaction. While the calculation in itself is pretty straightforward, preparation for accuracy and maximizing insight from the very basis requires clarity about the formula, examples, and best practices. In this section, explore how NPS is calculated, its application for different customer segments, common mistakes that one can easily avoid, and benefits arising due to automation.
4.1 Formula for Net Promoter Score
The formula for calculating NPS is straightforward: NPS = (% of Promoters) - (% of Detractors) Customers are classified according to their responses: Promoters (score between 9–10), Passives (score between 7–8), and Detractors (score between 0–6). Passives are not included in the calculation since they neither add nor take away from your overall score. The result is a score between -100 and +100.
4.2 Example of Calculating NPS
To give you an example, if you ask 100 customers and 50 are Promoters, 30 Passives, and 20 Detractors, the math is as follows: Promoters: 50% Detractors: 20% NPS = 50% - 20% = +30 This gives you a quick snapshot of customer loyalty where the higher score means stronger advocacy for your brand. Try Benty’s free NPS analysis tool to effortlessly calculate your Net Promoter Score.
4.3 Calculating NPS based on Segments
It is often more meaningful to calculate NPS across different segments of customers, such as by demographics, regions, or stages in the customer lifecycle. For instance: The male customers’ NPS could be +40, while female customers score +50. High-value customers may yield a greater NPS than low-value customers. Segmentation-based analysis will help businesses to identify their strengths and weaknesses. Companies could then inform strategies based on detailed analytics. With Benty’s free NPS analysis tool, you can quickly calculate segment-based NPS in just minutes. Simply copy and paste your NPS data or upload your NPS document to view both overall and segment-based NPS. Check out this sample report showcasing output of Benty’s free NPS analysis tool.
4.4 Common Mistakes in NPS Calculation
Despite the simplicity of NPS, many businesses misclassify Passives, Promoters, or Detractors, use small, biased, or nonrepresentative sample sizes, and/or do not control for response rates, getting inaccurate insights as a result. Avoiding these traps means more dependable and actionable findings.
4.5 Automating NPS Calculations
Manual calculation of NPS can be very time-consuming, especially for large datasets or segment-based analysis. Automation tools like Benty make life so easy by automating response categorization, score computation, and reporting. With Benty’s free NPS analysis tool, you can quickly analyze your NPS survey in just minutes. Simply copy and paste your NPS data or upload your NPS document to view both overall and segment-based scores, score breakdown, AI-powered key insights and recommendations. Check out this sample report showcasing output of Benty’s free NPS analysis tool.
5. What’s a Good Net Promoter Score?
Understanding what constitutes a “good” Net Promoter Score is critical to judging customer loyalty and benchmarking your enterprise against industry norms. While NPS on the scale ranges from -100 to +100, what constitutes a good score depends on the industry, company size, and expectations of customers. An NPS above 0 normally indicates that your business generally has more promoters than detractors, and that is a good beginning. Scores above +50 are great and represent high customer loyalty, and scores above +70 are exceptional and mean world-class customer satisfaction.
Benchmarking of your NPS against industry averages is also significant. For instance, the average NPS scores range from +30 to +50 for SaaS companies.
Retail may be a bit lower because of the higher customer churn rate. Remember, a “good” NPS is not just about the score-it’s about the story behind it. Understanding why customers are promoters, passives, or detractors provides actionable insights to improve the customer experience. Regularly tracking your NPS and comparing it to your past performance is critical for sustained growth and customer satisfaction.
6. NPS Benchmarks Across Industries
NPS benchmarks differ widely from one industry to another because of the nature of customer expectations, competitive dynamics, and service models. Comparing your NPS against the industry standard will give you a sense of how your business stacks up and where to improve. Here is the list of industry benchmarks we use for report generation.
| Category | Subcategory | Poor | Average | Good | Excellent |
|---|---|---|---|---|---|
| Technology & Software | SaaS | <0 | 0-30 | 31-50 | 51+ |
| Software/Apps | <10 | 10-40 | 41-60 | 61+ | |
| IT Services | <0 | 0-20 | 21-40 | 41+ | |
| E-commerce & Retail | Retail (general) | <0 | 0-30 | 31-50 | 51+ |
| Online Shopping | <10 | 10-35 | 36-60 | 61+ | |
| Fashion/Apparel | <10 | 10-30 | 31-50 | 51+ | |
| Financial Services | Banking | <0 | 0-20 | 21-40 | 41+ |
| Credit Cards | <0 | 0-25 | 26-50 | 51+ | |
| Insurance | <0 | 0-15 | 16-35 | 36+ | |
| Healthcare | Healthcare Providers | <0 | 0-20 | 21-40 | 41+ |
| Pharma/Biotech | <0 | 0-25 | 26-50 | 51+ | |
| Health Insurance | <0 | 0-10 | 11-30 | 31+ | |
| Telecommunications | Telecom Services | <0 | 0-15 | 16-30 | 31+ |
| Internet Service Providers (ISPs) | <0 | 0-10 | 11-30 | 31+ | |
| Hospitality & Travel | Hotels | <10 | 10-30 | 31-50 | 51+ |
| Airlines | <0 | 0-25 | 26-50 | 51+ | |
| Travel Agencies | <10 | 10-30 | 31-50 | 51+ | |
| Automotive | Automakers | <10 | 10-30 | 31-50 | 51+ |
| Auto Dealers | <0 | 0-20 | 21-40 | 41+ | |
| Car Rental Services | <10 | 10-25 | 26-40 | 41+ | |
| Education | K-12 Education | <0 | 0-20 | 21-40 | 41+ |
| Higher Education | <0 | 0-25 | 26-50 | 51+ | |
| EdTech | <0 | 0-30 | 31-50 | 51+ | |
| Other | For miscellaneous industries | <0 | 0-20 | 21-40 | 41+ |
These benchmarks put your NPS in perspective and help you understand if you meet, exceed, or fall behind customer expectations in your industry. Keep in mind, however, that benchmarks are good to understand, but the real goal is beating your score over time by taking action from responses and solving customer needs.
7. NPS Survey Types - When and How Often Should You Send NPS Surveys?
Choosing the right type of NPS survey, along with the correct timing, helps gain meaningful insight. There are two main types of NPS surveys: Periodic or Relationship and Event-triggered or Transactional. Each type of survey plays a different role and helps the business capture other aspects of customer satisfaction and loyalty.
7.1 Periodic (Relationship)
Periodic surveys, sometimes referred to as Relationship NPS surveys, are those going out on some kind of regular recurrence, such as quarterly, semi-annual, and annual. The surveys measure the overall sentiment and loyalty across your customer base; give the big picture of how customers view your brand over time. They are good for showing the long-term trend and tracking the improvement in customer satisfaction.
7.2 Event-triggered (Transactional)
Event-triggered surveys, otherwise known as Transactional NPS surveys, go out right after a certain interaction or some kind of event occurred-for example, after a purchase, after a support call, or after a product onboarding. These questionnaires focus on their satisfaction with some particular experience that helps to reveal the strengths and weaknesses of certain important customer touchpoints.
8. Periodic vs. Event-triggered NPS Surveys
Understanding the difference between Periodic, or Relationship, and Event-triggered, or Transactional, NPS surveys is important in order to choose the approach that best fits your business goals. Each type serves a different purpose, and choosing the right one-or both-can make all the difference in the quality and depth of insights you will get.
8.1 Which NPS Survey Type Is Better for Your Business?
It all depends on your objectives. Measuring general customer sentiment and monitoring long-term loyalty are better carried out with Periodic NPS surveys. If you want to understand specific customer experiences to pinpoint areas for improvement, event-triggered NPS surveys will serve you better. A mix of both could be most effective for businesses that have a high volume of customer touchpoints, such as e-commerce or SaaS.
8.2 Advantages and Disadvantages of Periodic (Relationship) Surveys
Pros: ideal to measure overall brand perception and long-term trends. They offer a bigger view on customer loyalty. Cons: won’t precisely catch the immediate or specific pain points of customers, hence leaving less actionable data to work with.
8.3 Advantages and Disadvantages of Event-triggered (Transactional) Surveys
Pros: In real-time responses about particular events. They help address those issues immediately in order to improve processes. Cons: May lack the big picture of overall customer sentiment and loyalty.
8.4 Hybrid Approaches
Combining periodic and event-triggered NPS surveys creates a hybrid approach that will enable balance in long-term insights with actionable, real-time feedback. For instance, a SaaS company might send periodic surveys to measure overall customer loyalty quarterly, while using transactional surveys after product onboarding or support interactions. This dual approach ensures you don’t miss either the forest or the trees, providing a complete view of your customer satisfaction landscape. By understanding the strengths and weaknesses of each survey type and adopting an approach tailored to their needs, businesses can effectively leverage NPS in fostering customer loyalty and improving their customer experience.
9. What Can You Measure Using NPS?
The Net Promoter Score is not only a tool to measure customer loyalty but also a source of insight into several other critical business metrics. By learning what NPS says about your customers, you are able to make data-driven decisions which enhance their experience, boost profitability, and lead to long-term relationships.
9.1 Customer Lifetime Value (CLV)
NPS can be a strong predictor of one’s future spending potential. Promoters who actively advocate for your brand are often much more engaged, and therefore their CLV is usually higher. You will be able to locate high-value customers, adapt your retention strategy, and maximize revenue opportunities by analyzing NPS in relation to purchase history and engagement patterns.
9.2 Customer Retention Rates
Your NPS score is directly proportional to Customer Retention Rates. Promoters are much more likely to remain with your brand, while Detractors risk churning. Monitoring NPS over time lets you see trends and signs of slipping loyalty, thus enabling you to take proactive measures toward retaining customers. The more responses to the issues raised in the survey, the better satisfaction and retention rates will be. Taken together, these metrics-CLV and retention rates-demonstrate how NPS can be used as an indicator of your business regarding long-term growth and customer satisfaction.
10. What Can You Do with Your NPS Survey Result?
Understanding and leveraging your Net Promoter Score goes beyond simply measuring customer satisfaction. It is used to provide real-world insights that will drive your business strategies toward better customer experiences and growth. Following are the ways to maximize the potential of your net promoter score:
10.1 Assess Customer Satisfaction and Churn Risk
NPS survey responses go a long way in deciphering customer sentiment. Let their use be extended toward assessing whether or not your customers are content, or display any signs of dissatisfaction that may culminate in churn. The process of early detection enables focused customer retention.
10.2 Segment Your NPS Responses
Segment your NPS survey results into promoters, passives, and detractors to create targeted engagement strategies with a clearer understanding of the needs of your customers.
10.3 Share Results with Stakeholders
Communicate your NPS findings with internal and external stakeholders. Sharing this data ensures that all are aligned in terms of customer sentiment and can contribute to its improvement.
10.4 Monitor Trends Over Time
Continuously monitor your NPS to spot trends or a movement in customer sentiment. This gives you insight into how changes in your business are perceived and when you need to change course.
10.5 Extract Insights
Use the insights from NPS to drive decisions across everything from product to customer service. NPS will show you what initiatives are specifically touching customer needs.
10.6 Map Customer Journey
Integrate NPS data into customer journey mapping to identify key touchpoints driving satisfaction. This helps in finding opportunities to improve experiences at critical stages of the customer lifecycle.
10.7 Personalization of Marketing Efforts
Personalize your marketing efforts based on customer sentiment. Engage promoters with advocacy programs while listening to the concerns of detractors to rebuild trust.
10.8 Action Plan
Create an action plan based on your NPS results. Highlight specific areas of improvement and establish quantifiable objectives that will help in improving customer satisfaction.
10.9 Close the Loop with Customers
Follow up with customers after collecting NPS feedback. Solve problems highlighted by detractors, thank promoters for their loyalty, and show them their suggestions are taken seriously and will be put to good use. By applying these methods, your NPS score will be in a position to create customer loyalty, reduce churn, and drive business performance overall.
11. Financial Evaluation of Net Promoter Score
Net Promoter Score is not only a means of measuring customer satisfaction but also a tool carrying a direct financial implication on your business. From a financial perspective, NPS is a driver of profitability, optimization of resources, and long-term growth strategies.
11.1 ROI of NPS Programs
Investing in an NPS program can deliver measurable returns. Businesses with high NPS scores often enjoy greater customer retention, increased referrals, and higher Customer Lifetime Value (CLV). By calculating the Return on Investment (ROI) of NPS initiatives, you can show how addressing customer feedback translates into tangible financial benefits, such as reduced churn and higher revenue.
11.2 Cost of Ignoring NPS
Failure to act on NPS will cost money. Failure to listen to customer feedback allows growing dissatisfaction to continue, thus driving churn rates up and taking a hit on brand reputation. The cost of inaction is the missed opportunity for growth and the costs of winning new customers to replace those lost. Measuring these costs highlights the critical role of NPS in retaining customers and sustaining competitive advantage.
11.3 How NPS Impacts Revenue and Growth Metrics
A strong NPS is directly proportional to positive revenue trends and accelerated growth. While promoters are the brand ambassadors who create referrals and organic growth, detractors indicate where an intervention is required. Businesses that prioritize NPS programs often see improved financial metrics such as higher NRR and increased market share. By aligning NPS with financial objectives, you can create a data-driven strategy to maximize revenue and fuel sustainable growth.
12. How to Improve NPS?

Improvement of NPS deals with building good relations with customers and increasing customer experience. In other words, it’s resolving pain points, increasing the quality of service, and creating a context in which customers will be delighted to become brand advocates. The next section deals with a look at what one can really do to improve NPS - and some common mistakes to avoid.
12.1 Improving Customer Experience (CX)
A superior NPS can be rooted in base-level customer experience. Through detailed analysis of the feedback provided by detractors and passives, find out what hurts them or causes them a lot of effort. Smooth processes, high-quality products, and nice touches along the journey. Treatment of customers at every instance gives them reasons for being promoters, speaking positively for your brand.
12.2 Training Employees
Happy employees, engaged employees, create better experiences for your customers. Equip your team with training that focuses on customer empathy, active listening, and problem-solving skills. Employees on the front line should feel empowered to resolve issues effectively, exceed expectations, and turn detractors into promoters. Internal alignment on delivering exceptional service is key to NPS growth.
12.3 Common Mistakes When Trying to Improve NPS
Don’t commit some common mistakes that stand in the way of your NPS improvement process. Overemphasizing quick fixes, neglecting feedback, or focusing on detractors at the cost of promoters-these limit progress. Moreover, incentivizing for responses to surveys distorts the results and can hurt the integrity of your NPS. Focus on sustained improvements and true customer engagement that bring lasting positive change.
13. Common Pitfalls and How to Avoid Them
While the Net Promoter Score survey is such a powerful tool to measure customer loyalty, it does have a number of drawbacks. This section depicts some of the most frequent pitfalls businesses are faced with while conducting NPS surveys and provides actionable ways to avoid those pitfalls in order to preserve the integrity of your results.
13.1 How to Avoid Overwhelming Customers with Too Many Surveys
Survey fatigue is a condition when too many surveys are thrown at customers, which results in low response rates or rapid, inaccurate answers. To avoid this, carefully plan the cadence of your NPS surveys. Balance regular feedback collection with customer convenience by timing surveys in conjunction with meaningful touchpoints, such as post-purchase or post-support interactions. Keep your surveys concise and clearly communicate their purpose to show customers that their feedback matters.
13.2 Approaches to Minimizing Bias in NPS Responses
Response bias is likely to distort the results of NPS and make valid estimates of consumer sentiment difficult to come by. For this purpose, it is important to phrase all survey questions neutrally. To encourage candid consumer responses, maintain a safe, anonymous space in which customers have no fear of judgment. Likewise, avoid rewards programs that may ultimately bias scores through skewed incentives. Segment your population carefully to learn about patterns indicative of unbiased feedback and retool your process for authentic responses in an improved manner.
14. Integrating NPS with Other Metrics
Net Promoter Score or NPS is a powerful means to gauge the loyalty of one’s customers; however, its real strength is achieved when it is combined with other important customer experience metrics. This section takes a closer look at how the integration of NPS and metrics such as Customer Satisfaction Score and Customer Effort Score presents a fuller view of customers’ perceptions and experiences. Aggregated, these measures will be helpful for businesses in actionable insight discovery, pain point solving, and strategy building in-depth to increase customer loyalty and retention.
14.1 Customer Satisfaction Score (CSAT): Complement of NPS towards CSAT
CSAT is a measure of customers’ immediate satisfaction with one specific interaction or part of your product or service. While NPS talks about overall loyalty and the relationship of a long-term basis with customers, CSAT finds the touchpoints affecting customer satisfaction. Integrating NPS with CSAT can link short-term feedback with long-term loyalty trends. For instance, a low score on the CSAT of a particular support interaction may explain why a customer moved from being a Promoter to a Passive or Detractor and you can take corrective action on time. With Benty’s free CSAT analysis tool, you can quickly analyze your NPS survey in just minutes. Simply copy and paste your NPS data or upload your NPS document to view both overall and segment-based scores, score breakdown, AI-powered key insights and recommendations. Check out this sample report showcasing output of Benty’s free CSAT analysis tool.
14.2 Customer Effort Score (CES): The Relationship Between NPS and CES
CES measures the degree of ease with which customers can experience your company-e.g., to resolve an issue or make a purchase. Generally speaking, high effort leads to frustration, which negatively impacts loyalty and NPS. By integrating CES with NPS, you’ll identify if customers’ experiences are driving their loyalty scores. For example, if your customers are very loyal-only highly positive NPS scores-but are expending a lot of effort on important tasks-high CES score-it signals long-term retention risk. Taken together, NPS and CES let you know how effort is impacting loyalty and enables prioritization of the improvements that would have the biggest impact on customer friction and customer experience. With Benty’s free CES analysis tool, you can quickly analyze your NPS survey in just minutes. Simply copy and paste your NPS data or upload your NPS document to view both overall and segment-based scores, score breakdown, AI-powered key insights and recommendations. Check out this sample report, showcasing output of Benty’s free CES analysis tool.
15. Advanced NPS Analytics
While the basic computation of scores is what most NPS analytics do, advanced NPS analytics digs deep into customer behavior and future trends. With these modern ways of analytics, such as predictive analytics and text analytics, businesses can make data-driven decisions toward customer satisfaction and proactive problem-solving. This section explores how these advanced tools empower businesses to unlock the full potential of NPS data and drive customer-centric strategies.
15.1 Predictive Analytics
Predictive analytics applies historical NPS data to project future customer behaviors and trends. It identifies the patterns and correlations from which businesses can predict shifts in customer loyalty, risks of churn, and the effective impact of particular actions on overall NPS. For instance, predictive models may determine those segments of customers at risk of turning into Detractors or identify which improvements will turn Passives into Promoters. This forward-looking approach helps organizations stay ahead of customer needs and take proactive measures to ensure loyalty and retention.
15.2 Text Analytics
NPS surveys often include open-ended responses, where customers explain the reasons behind their scores. Text analytics uses natural language processing (NLP) to analyze this qualitative feedback, uncovering trends, themes, and sentiment at scale. Businesses can draw out common customer complaints, frequently praised features, or emerging issues across segments. This could be analyzing the feedback from Promoters, for example, which may indicate key strengths to amplify, while insights from Detractors spotlight areas needing immediate attention. Text analytics takes raw customer comments and turns them into actionable insights, rounding out the NPS scores with the “why” behind the numbers. Benty provides a range of free text analytics tools designed to simplify your workflow. You can quickly analyze your survey or feedback data by copying and pasting it or uploading a document. In just minutes, generate AI-powered insights. With our free sentiment, and emotion analysis tools, you can uncover user sentiments, emotions, and actionable AI-driven recommendations. Our free customer analysis tool identifies feature requests, bug reports, likes, dislikes, features improving or declining over time, and competitor comparisons. Additionally, our free NPS, CSAT, and CES analysis tools calculate overall and segment-based scores (when applicable) while delivering AI-powered insights and tailored recommendations.
16. Legal and Ethical Considerations
An NPS program should be implemented in a manner that is legal and ethical to safeguard customer trust and ensure that relevant regulations are met. This section emphasizes the protection of customer data and ethical survey best practices to provide a transparent, respectful, and trustworthy feedback process.
16.1 Data Privacy
Data privacy is one of the most important issues when collecting and analyzing NPS data. Companies must comply with data protection regulations such as GDPR, CCPA, or any other relevant legislation, which guarantee that customer information is securely stored and used only for the purpose intended. Transparency is key: customers should be informed about how their data will be treated and be given an opportunity to opt out of sharing personal information. Compliance and customer trust will depend on the robustness of data security, encryption protocols, and periodic audits.
16.2 Ethical Survey Practices
Ethical survey practices ensure a fair collection and interpretation of NPS data with no manipulation or bias. This includes framing the questions neutrally, avoiding leading language, and letting the customer have a preference for participation. Surveys should be voluntary, with businesses avoiding any pressure on the customer to provide feedback. In addition, the ethics include responsible usage of the data: making no discriminatory actions based on feedback and anonymizing survey responses when that is necessary in order to keep identity protection. Ethics help an organization build integrity and reliability in NPS programs.
17. The NPS for Measuring Employee Loyalty: eNPS
eNPS is a variant of NPS and is meant for measuring employee satisfaction and loyalty towards the organization. Just as the NPS would help in measuring customer loyalty, eNPS gives insight into how employees feel about their workplace, creating a strong internal culture that impacts customer experiences and business outcomes. This section explores how to effectively implement eNPS, its best practices, and its correlation with overall NPS scores.
17.1 eNPS Best Practices
With the best practices for eNPS in place, there should be truthful and actionable feedback from all levels. You ask your employees just a single, very direct question, for instance: “How likely are you to recommend this company as a great place to work? ”. Run surveys quarterly or bi-annually. Make open responses anonymous. Avoid fatigue with over-surveying. Act upon what was said when receiving feedback. Sharing the results transparently and creating a clear action plan to improve areas of concern helps build trust and engagement among employees.
17.2 Correlation Between eNPS and NPS
There is a very strong linkage between eNPS and NPS, whereby engaged and satisfied employees are more likely to deliver great customer experiences, leading to a positive impact on customer loyalty. Businesses with high eNPS scores generally enjoy higher NPS scores, since an incentivized workforce is more prepared and able to meet and exceed customer expectations. Therefore, looking at both metrics together can help an organization find the points at which employee satisfaction affects customer outcomes and develop strategies that correlate employee engagement with customer success.
18. Future Trends in NPS
Advancements in technology and the changing landscape of customer expectations continue to push the evolution of the Net Promoter Score. Organizations are seeking to derive more meaningful, quicker, and actionable insights than ever before from NPS. The section shall look at emerging trends in the use of AI, real-time capability, and more that shape the future of the NPS in helping organizations stay ahead in the understanding and improvement of customer loyalty.
18.1 AI and Machine Learning
Artificial intelligence and machine learning are changing the way NPS data is analyzed. These technologies let businesses process large volumes of feedback in a very short period of time, discovering patterns, trends, and root causes that would be hard to find by human analysts. AI-powered predictive analytics lets companies predict fluctuations in customer loyalty and take steps to prevent such fluctuations. Also, machine learning-driven text and sentiment analysis gives deeper insights from qualitative feedback-text data distilled into recommendations. With Benty’s free NPS analysis tool, you can quickly analyze your NPS survey in just minutes. Simply copy and paste your NPS data or upload your NPS document to view both overall and segment-based scores, score breakdown, AI-powered key insights and recommendations.
18.2 Real-Time NPS
Real-time NPS is disrupting how organizations monitor customer sentiment and act on it. Avoiding the dependence on periodic surveys, real-time NPS gathers responses in real time, letting business firms tackle issues as they happen or take advantage of opportunities that would really delight customers. This helps companies be more agile, catch emerging trends, and create closer relationships with their customers. Integrating real-time NPS into daily operations enables a business to monitor and improve its customer experience constantly to stay competitive in a fast-moving environment.
NPS, Net Promoter & Net Promoter Score are registered trademarks of Satmetrix Systems, Inc., Bain & Company and Fred Reichheld.
To stay informed about the launch of Benty and be among the first users, please leave your email address, and we will notify you when Benty is live 🚀